Московский экономический журнал 10/2019

УДК 339.564.2
DOI 10.24411/2413-046Х-2019-10043
Глобальный рынок углеводородов в 21 веке: основные тренды и
риски
Global hydrocarbon exports in the 21 century: general trends and risks
Гаврилова Нина Германовна, младший научный сотрудник, Федеральное государственное бюджетное учреждение науки – Институт Африки Российской академии наук, Центр изучения проблем переходной экономики
Gavrilova N.G., Junior Research Fellow, Institute for African Studies of the Russian Academy of Sciences, Centre for Transition Economy Studies, ninagavrilova1976@gmail.com
Аннотация:
За последние несколько лет в структуре мирового экспорта произошло значительное
увеличение доли углеводородов. На рост показателя оказало влияние и изменение
мировых цен на них, и увеличение объемов их добычи. В статье приводится экономическая характеристика экспорта крупнейших
мировых экспортеров углеводородов, определяется их доля в общем экспорте
стран. Автором определено, что значительное увеличение
объемов экспорта нефтепродуктов в США, Австралии, Индии и их уменьшение в Норвегии,
Иране, Кувейте, Нигерии и Великобритании вызвали изменение региональной структуры
мирового экспорта нефтепродуктов.
Summary:Over the past
few years, the share of mineral fuels in the structure of world exports has
demonstrated a significant increase. This growth was brought about both by
changes in world prices for hydrocarbons and an increase in their production
volumes. The article presents the economic characteristics of exports by the
world’s largest hydrocarbon exporters and determines the share of oil and
petroleum products in the total exports of these countries. The author identifies
the impact of a significant increase in the volume of exports of petroleum
products by the USA, Australia and India and a corresponding decrease by
Norway, Iran, Kuwait, Nigeria and the United Kingdom on the regional structure
of global exports of hydrocarbons.
Ключевые
слова: мировой экспорт, минеральное топливо, углеводороды,
нефтепродукты, экспортеры.
Key words: world export, mineral fuels, hydrocarbons, petroleum
products, oil exporters.
According to basic models of trade by
Adam Smith, David Ricardo, Eli Heckscher and Bertil Ohlin (the Heckscher-Ohlin model), a country should specialize in industries in
which it possess a comparative advantage: it would be optimal for a country endowed
with an abundance of natural resources to specialize in their extraction and
processing. However, if the country’s export is based on the sale of just one product
or a small number of them, the country may encounter the paradox of the
so-called “immiserizing growth”. In 1977, The
Economist newspaper coined the term “Dutch disease” to describe the contemporary
situation in export sphere of the economy of the Netherlands. Since 1959,
natural resources had been actively developed by this country, and there had
been a sharp increase in the volume of exports of the Netherlands due to the
soaring production of natural gas. The newspaper’s analysts calculated some economic
indicators of the country and determined that, on the one hand, the local
currency had strengthened for a short time due to the influx of foreign capital
but, on the other hand, the unemployment rate had increased (from 1.1% in 1970
to 5.1% in 1977). The situation also affected the development of non-extractive
sectors of the economy, which lost their competitiveness in foreign markets due
to the investors’ positive bias toward the extractive sector. According to the
analysis by The Economist, “97
developing countries with a high ratio of natural resource exports to GDP had
low growth rates in the 1970s and 1980s. When the natural resources are
depleted, little will remain to maintain the economy… If the countries rich
in raw materials do not channel their fortunes to diversify their economies or
lower the real exchange rate, the Dutch disease can become fatal” [1].
In 2017, after a fall in 2015 and 2016, the value of world exports of goods increased by 11%, mainly due to an increase in the exports of fuel and mining products by 28%. The share of the latter in world exports increased from 13% in 2016 to 15% in 2017. If we consider the exports of mineral fuel in the longer term, from 2001 to 2018, its share in total world exports grew by 3% (Fig. 1). Figure 1 highlights product categories that occupy the most significant places in world exports.
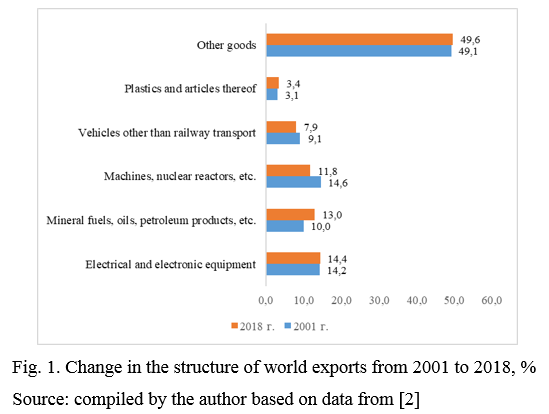
World hydrocarbon exports demonstrated the most
significant growth among all product categories except for Electrical and electronic equipment, which occupied the leading position
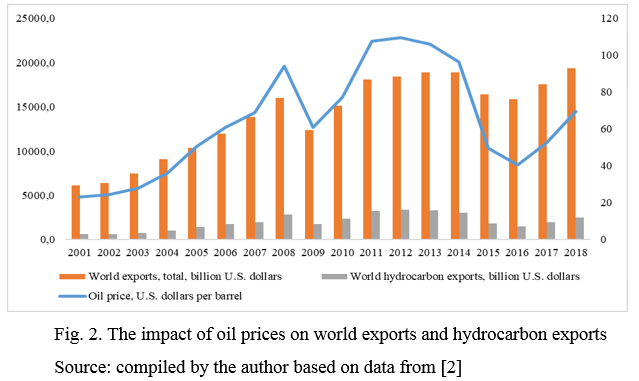
in the world exports. The average price of oil in 2016 amounted to $40.7 per
barrel, but by 2018 it rose to $69.5 per barrel, which was still lower than the
figure for 2012, when the oil price peaked at $109.5 dollars per barrel [3].
Fluctuations in oil prices affected global exports in general and hydrocarbon
exports in particular (Fig. 2).
Fluctuations in oil prices during 2018, when the lowest price was observed in February ($59.2 per barrel) and the highest in October ($76.41 per barrel), were influenced by several positive and negative factors. The positive ones included the continued growth of engineering industry, which triggered faster growth in China and the USA, the restoration of economic growth in Russia, etc. The negative ones were the slowdown in economic growth in India, the fall in oil demand in Japan due to the reactivation of several nuclear reactors restored after the nuclear accident at Fukushima, and reduction of energy consumption in the European Union due to high energy prices [4].
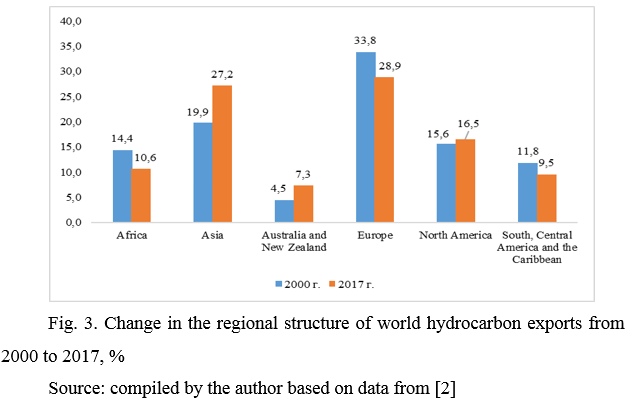
Between 2000 and 2017, world hydrocarbon exports underwent significant changes in the context of regions (Fig. 3). The volume of exports of the African countries decreased over the reviewed period by almost 4%, the European countries – by 5%, the countries of South and Central America – by 2%; however, hydrocarbon exporters in Asia, Australia and North America increased their share in world exports by 7.3%, 2.8% and 0.9%, respectively.
In 2017, Middle Eastern exports amounted to $961
billion, of which more than a half came from fuel and mining products. African
exports as a whole grew 18% mainly due to increased supplies of oil and
minerals to the global market; since 2012, African exports grew for the first
time. Africa’s oil exporters combined accounted for 35.0% of all African
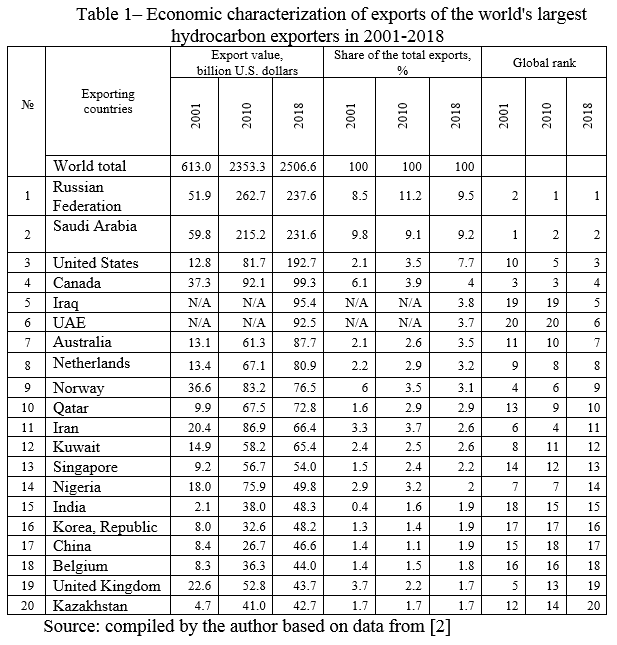
exports in 2017, compared with 31.9% in 2016 [3]. Table 1 summarizes the world’s
largest hydrocarbon exporters from 2001 to 2018.
It is worth noting that over the reviewed period, each of the countries listed in the table significantly increased its hydrocarbon exports in dollar terms. However, the structure of world exports of hydrocarbons underwent significant changes during the period. In 2001-2018, Russia’s position strengthened, and it became the leader in terms of the value of hydrocarbons sold in the world market. The United States, Australia and India significantly increased exports of petroleum products. Norway, Iran, Kuwait, Nigeria and the United Kingdom, on the contrary, weakened their positions in the world ranking of the largest exporters of oil and petroleum products.
To determine the dependence of countries’ total exports on hydrocarbon exports, the author identified 80 countries, which exported mineral fuels, on the basis of data provided by UNCTAD. Figure 4 shows countries where hydrocarbon exports constitute more than 40% of total exports.
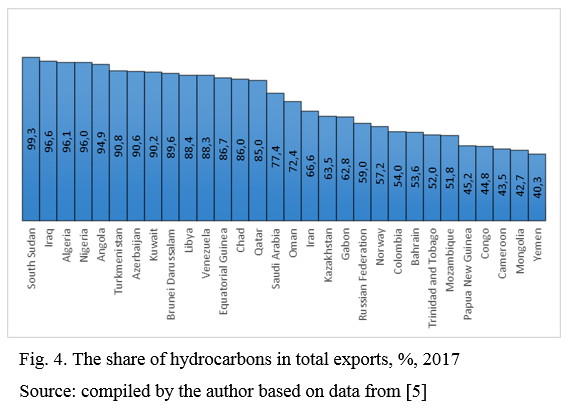
In 30 countries of the world, the share
of hydrocarbon exports exceeds 40%. The highest dependence is observed in
countries where share of hydrocarbons in total exports is greater than 90%:
South Sudan (99.3%), Iraq (96.6%), Algeria (96.1%), Nigeria (96.0%), Angola
(94.9%), Turkmenistan (90.8%), Azerbaijan (90.6%) and Kuwait (90.2%). South
Sudan, which emerged as a result of the division of Sudan into two countries in
2011, presents an extreme case of nearly absolute dependence on hydrocarbon
exports [7].
Concentration of exports in several
commodities may drastically increase economic and political risks. Economic
risks, first of all, include volatility and instability in obtaining foreign
exchange earnings, which has severe macroeconomic implications in the form of
reduced economic growth, higher unemployment, inflation, capital outflows,
insufficient foreign investment, etc. Political risks include lower quality of
governance at the national and regional levels, escalation of tensions between
the center and the periphery, etc. Export diversification should be aimed at
mitigating these risks.
Bibliography
1. What Dutch disease is, and why it’s bad. The
Economist. Nov 5th 2014.Электронный ресурс. URL:
https://www.economist.com/the-economist-explains/2014/11/05/what-dutch-disease-is-and-why-its-bad.
2. The International Trade Centre 2018. Electronic
resource. https://www.trademap.org/Country_SelProduct_TS.aspx?nvpm
3. World Trade Statistic Review 2018. World Trade
Organization. Electronic resource. URL: https://www.wto.org/english/res_e/statis_e/wts2018_e/wts2018_e.pdf
4. Enerdata. Independent research and consulting firm
specialising in the analysis and modelling of the global energy
markets. Global Energy Trends 2019 Edition. Electronic resource. URL:
https://www.enerdata.net/ system/files/publications/global-energy-trends-2019-edition-enerdata.pdf
5. World Trade Organization 2018. International trade
statistics. Electronic resource. URL: https://data.wto.org/.
6. Morozenskaya E.V. Ways Toward the Sustainable
Development of Africa // Asia and Africa Today.
2017, Vol. 4 (717), pp. 43-46 [in Russian].
7. Kostelyanets S.V. Sudan after the Split of the
Country: Seeking to Resolve the Crisis // Asia and Africa Today. 2014, Vol. 10 (687),
pp. 31-35 [in Russian].