


УДК 336, 339
DOI 10.24411/2413-046Х-2019-19034
ПРОВЕРКА ГИПОТЕЗЫ ЭФФЕКТИВНЫХ РЫНКОВ С ИСПОЛЬЗОВАНИЕМ ТОРГОВОЙ СТРАТЕГИИ ГРАФИКОВ ЯПОНСКИХ СВЕЧЕЙ: ДАННЫЕ С РОССИЙСКОГО РЫНКА АКЦИЙ
CHALLENGING EFFICIENT MARKET THEORY BY USING JAPANESE CANDLESTICK STRATEGY: EVIDENCE FROM THE RUSSIAN STOCK MARKET
Березюк Денис Эдуардович, Национальный Исследовательский Университет «Высшая Школа Экономики», Санкт-Петербург, Россия
Denis E. Berezyuk, of National Research University “Higher School of Economics”, St. Petersburg Campus, Russia
Аннотация: В статье исследуются возможности торговой стратегии технического анализа, использующей графические модели Японских Свечей на Российском Рынке Акций. Другие технические индикаторы и математические осцилляторы, такие как стоп-лосс позиции, различные методы определения тренда, фактор объёма торгов и дивидендные выплаты были оптимизированы и использованы для формирования портфеля российских «Голубых Фишек» для инвестора, а также создания оптимальных методов управления инвестиционным портфелем в реалиях Российского Рынка. Метод Монте-Карло и Бутстрэппинг были использованы для генерации случайных наборов данных по паттернам исторических котировок цен акций и определения статистической значимости полученных при помощи оптимизированной торговой стратегии результатов. Вычисления показали, что торговая стратегия Японских Свечей и её модификации не приносит значимую доходность выше среднерыночной для инвестора на относительно спокойных этапах развития Российского Финансового Рынка. Однако статистически значимая прибыль торговой стратегии Японских Свечей на робастных данных, в разы превышающая доходность Российского Рынка, может говорить о высокой эффективности её использовании инвесторами. Также, возможно формирование гипотез о не до конца сформированной эффективности Российского Рынка Акций, так как рынок был «обыгран» с использованием торговой стратегии технического анализа. Графические модели Японских Свечей, разработанные ещё в начале 18-ого века в Японии, оказались эффективными в течение 2008 и 2014 годов, когда высоко волатильный Российский Рынок Акций имел отрицательный тренд. Однако эффективными на «медвежьем» рынке оказались и «бычьи» графические модели, предсказывающие краткосрочные изменения на рынке акций. Таким образом, полученные результаты помогли разработать эффективную торговую стратегию для инвестора на Российском Рынке Акций, которая способна принести высокую прибыль в течение нестабильных этапов развития рынка с отрицательным трендом.
Summary: This paper investigates possibilities of technical trading strategy using Japanese Candlestick patterns approach in the Russian equity market. The other Technical trading rules and techniques such as stop-loss positions, trend identification perspectives, volume factor and the dividend factor were collaborated to form a portfolio of Russian “blue caps” stocks for an investor and create methods of its optimal management in the reality of Russian market. Using methods of Monte-Carlo and bootstrapping for random datasets generation the fact of statistically significant return using Japanese Candlestick strategy was not found on test dataset, but robustness check showed strong value for investor on the high-volatile periods of Russian market. Results show that Japanese Candlestick patterns, which were firstly discovered and used in the beginning of 18th century in Japan, have high predicting ability in “bearish” Equity Market of Russian Stocks during 2008 and 2014, when economic and political situation in Russian Federation was not stable. However, not only “bearish” but also “bullish” Candlestick patterns were effective in the market with negative trend and high standard deviation from the daily mean return. These results were used to form an effective trading strategy of Japanese Candlesticks for an investor in the Russian Equity Market during high-volatile periods of time.
Ключевые слова: Графические модели Японских Свечей, технический анализ, Теория Эффективных Рынков, торговая стратегия, нестабильный рынок.
Keywords: Japanese Candlesticks, Technical analysis, Efficient Market Theory, trading strategy, high-volatile market.
Introduction
Technical analysis is a method of forecasting the future price dynamics of financial assets and is based on such market information as trading volumes of financial instruments, historical prices and other market statistics. Proponents of technical analysis point out the following positive features of this market forecasting methodology: broad market review which arises through the analysis of the large number of indicators; convenience of using this analysis with all financial instruments and assets; the ability to detect patterns in historical data that can occur again in the future [17]. All the strengths of technical analysis are generally based on an assumption that the various indicators and indexes of this method contain determinative for future trends formation in the market information [12]. This statement contradicts the generally accepted in the 20th century Theory of Market Efficiency (EMH) which claims that all market information is contained in the prices of financial assets in the markets [5]. This follows the unpredictability of market price changes for all its participants, i.e. pieces constantly change around their “fair market value”, and therefore the return above the average market’s is impossible [16].
The evidence of various technical trading rules profitability was shown in a number of articles. For example, “filter” technical trading rule with transaction costs showed statistically significant return for DJIA index stocks. The long and short moving averages in the MA crossing trading system brought profit higher than market average in the New-York Stock exchange [6]. Modern machine learning methods such as neural network improved investment decisions and create an effective trading strategy for stocks from S&P 500 and BSE indices [1]. However, the opposite results were shown by using these and other techniques of technical analysis in the articles [5] and [11]. Contradictory results of scientific works on given subject, researches of the absence of constant rationality in investors’ and other market participants’ actions and also increasing popularity of technical analysis using among many international markets and financial assets allowed academicians to look at this topic from different point of view [9].
This article explores the method of technical analysis, Japanese Candlestick patterns and its applicability for the effective trading strategy formation in the Russian Equity market. The Japanese Candlestick patterns, which send short-term trading signals for investor, were first mentioned in the early 18th century by Japanese rice business owner [12].
This paper is one of the first which explores the Japanese Candlestick technique of technical analysis in the realities of Russian Stock market. The analyzed in this article data were stocks’ daily historical prices of the Moscow Stock Exchange (MICEX) from 1999 to 2018. The Russian financial market choice explained by both the lack of scientific researches of possibilities of technical analysis in the market and the assumption that the Russian Equity market is too “young” for Market Efficiency formation. Also, the world’s largest and most well-known sources of market data, such as Reuters, have begun to provide information of daily open, close, maximum and minimum prices of financial assets since 1990 which is ideally correlated with the choice of market and research time [11].
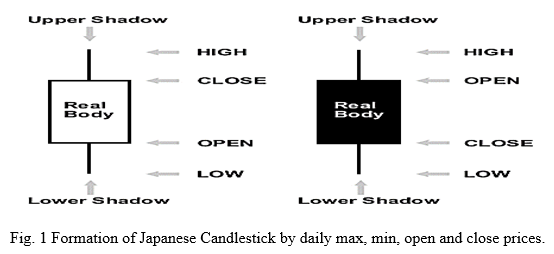
Daily Japanese Candlestick pattern is a figure consisting of the candle “body” and “shadows” which represent daily price of opening and closing, maximum and minimum respectively (Figure 1). In fact, candlestick patterns are not different from the price charts, accustomed to the western investors, but the information presented in the Japanese Candles is much easier to interpret: candlesticks show the interaction of sellers and buyers in the market and give the opportunity to penetrate “inside” the financial market, to see the relationships within the investigated data [12]. Sequences of Japanese Candles form candlestick patterns, each carries its own meaning and market psychological implication [14]. The using of all 4 daily prices of a certain financial asset makes technical analysis a distinct difference from the other methods of technical analysis, as one candle contains much more information than in the usual closing prices time series [11].
This paper tests 3 modifications of the basic Japanese Candlestick trading strategy: stop-loss, trailing stop-loss and take profit positions separately and together – these technical-trading indicators are included to trading systems to reduce losses from unprofitable trades. Following optimized trading techniques can significantly improve the profitability of the trading strategy for the investor [12].
The profitability of Japanese candlestick trading strategy is tested by t-test, Monte-Carlo method and bootstrapping for random data samples with historical data patterns formation [11,15]. Profits of trading strategy in test datasets will be compared with those by “Buy&Hold” passive strategy of Monte-Carlo and bootstrapping data to determine statistical significance of results.
The structure of this article is organized as follows: in section “Japanese Candlestick Patterns” description of some patterns and their trading signals are presented. Section “Measures of trading strategy profitability” describes methodology for evaluating the profitability of optimized trading strategies. Then, section “Empirical results” shows returns of Japanese Candlestick trading strategy and its modifications and also displays statistical significance of following results. Finally, last section concludes this paper.
Japanese Candlestick Patterns
The method of technical analysis based on the Japanese Candlestick charts was mentioned in the beginning of 18th century in Osaka, Japan, where rice trader Munnelusa Homma sketched opening, closing, maximum and minimum daily prices of the rice. One day, he noticed Candlestick sequences followed by certain market trends in the future. These algorithms were Japanese Candlestick patterns, which the Western world learned only in the end of 20th century with the release of the book “Japanese Candlestick Charting techniques: A Contemporary Guide to the Ancient Investment Techniques of the Far East” [14].
All the 106 Japanese Candlestick patterns are divided into types by the number of pattern formation (from 1 to 5 days), by market nature which is predicted by pattern (bullish/bearish) and by character of market trend (continuation/reversal patterns) [12]. The convenience of Japanese Candlesticks and their patterns is the simplicity of their interpretation. For example, the “Morning Star” pattern, consisting of 3 daily candles, is reduced to only 1 “reversal” candle called “Paper Umbrella” (Figure 2).
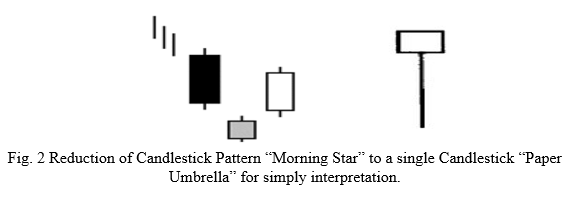
The mathematical interpretation of Japanese Candlestick patterns is simple to understand. For example, bullish reversal pattern “Morning Star”, consisting of a long black candle (day closing price is below the opening) on the first day, followed by a small candle (uncertainty of market participants occurs), and then white candle smaller than first evolves on the third day, closing price is slightly higher than the middle of the first black candle (Figure 2), mathematically described in this way:
- First trading day (t) of following pattern: O(t) > 0;
- Second day (t+1): I C(t+1) – O(t+1) I > 0, C(t) > C(t+1) и C(t+1) > O9t+1);
- Third day

where O(t) – the opening price of an asset on a trading day t, C(t) – closing price on day t. It is necessary to note that the terms describing daily candles (long, short, etc.) are subjective at visual graphs but mathematical algorithms are used in trading systems [12].
The combination of stop-loss indicators is one of the methods of improving the trading strategy [7]. The main point of all stop-loss positions is automatic exit from trade in case of violation of the initial conditions specified by the investor [14]. Trailing stop-loss indexes are the modification of the stop-loss position [13]:
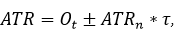
where ATR – trailing stop-loss position; – opening price on day t; – trailing stop period parameter; – optimizing on the training dataset factor.
Take profit is designed to exit trades when the investor receives necessary amount of profit (set before the creation of trading strategy) and in this article it equals 8%.
In this paper 16 most popular in academic literature Japanese Candlestick patterns were investigated in the realities of Russian Equity market. The list of patterns and their descriptive statistics can be seen in the Table 1 in the next section. Also, two approaches of trend defining were compered (Moving Average and Exponential Moving average) in order to find the most effective trend approach in the Russian market [11,12]. The pattern searching and effectiveness calculation in the historical data were analyzed using Candle Scanner Software[1].
Measures of trading strategy profitability
The Japanese Candlestick trading strategies’ returns are tested for statistical significance using t-test (reject r=o, where r – mean return), Monte-Carlo method and bootstrapping (to compare profits to the hypothetical returns of the “Buy&Hold” strategy) [11,15]. This article will also verify the hypothesis of candlestick patterns’ only short-term effectiveness of predictive power (5/10/15 day holding periods) [12,14].
The process of Japanese Candlestick trading strategy optimizing for the investor in the Russian Equity market is divided into 4 stages, which represents movement from “simplest” to the most “complex” trading strategy modification:
- Japanese candlestick patterns following trading strategy with 5- and 10-days holding periods of trade positions. There are none optimizing parameters in this strategy, so, returns were calculated from the IPO of Russian “Blue Caps” to 31.05.2018 (without division into training and test data samples). The statistical significance of profits is tested using Student t-test [11];
- Japanese Candlestick strategy modified by stop-loss indicator of technical analysis. The historical data of stocks is divided into training sample to train trading system (70% of time-series) and test sample (30%) to check the effectiveness of trading strategy;
- Japanese Candlestick trading strategy modified by stop-loss, trailing stop-loss and take-profit (8%) indicators. The methodology remains;
- Is similar to 3rd trading strategy, except for the take-profit positions.
The bootstrapping ang Monte-Carlo methodology has several advantages in relation to Student t-test to check the statistical significance of financial returns: skewness and leptokurtosis (thick tails) of returns’ distribution of financial assets accounting; dealing with time autocorrelations and conditional heteroscedasticity of returns. Also, the number of null models for data formation by Monte-Carlo method or bootstrapping make it possible to use unique historical data patterns to construct random datasets [11].
Choosing a null model for bootstrapping or Monte-Carlo method to form a data samples of assets is the first step in return statistical significance testing. In paper of technical analysis autoregressive process of the first stage (AR(1)), model GARCH in-Mean (GARCH-M), exponential GARCH model (EGARCH) as well as Random-Walk (RW) model were used, but regression coefficients and general data statistics (in particular 0.05 quantiles of returns) were close to each other among all null models [11]. In this article GARCH-M and RW models were used to fit data by bootstrapping and Monte-Carlo methods respectively.
The RW model represents the weak form of market efficiency (WEMH) of price changes independence in the market, so increments of financial asset price is fully random:
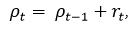
Where pt,t-1 – logarithms of financial asset prices in the time; – logarithmic return of an asset on t period of time, normally distributed with historical mean and variance [16].
The Generalized Autoregressive Conditional Heteroscedasticity in-mean model was introduced by Engle in 1987 [4] and in general form is represented in (1)-(3):
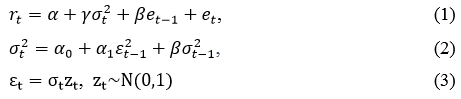
An error in this model,

, is conventionally normally distributed and its value at time t does not correlate with previous values in .

Conditional variance

is a linear function of the square of error and variance at previous moment of time t-1, which implies a positive consistent correlation in the second moment of return to the average. Conditional mean of return in this model rt is a linear function of conditional variance and noise at the previous time moment,

This process implies that volatility can change over time and expected return is a function of volatility as well as previous returns [11]. The parameters and standardized residuals are evaluated for each investigated in this paper stock in the Russian Equity market using Maximum Likelihood method.
GARCH-M model residuals are standardized using calculated standard deviations for the error process, then a series of residuals is formed. After that, integrated with valuation parameters, residuals series form a new representative time series of a financial asset closing price returns. Further, this data is exponentiated for the close price formation for specified period. The RW process of time series of asset closing price formation by Monte-Carlo method is “easier” because historical (in the training samples) mean of returns and their variance are used to form normally distributed return series which are to be exponentiated [11].
The process of bootstrapping and Monte-Carlo methodology is repeated 1000 times – the sufficient number of iterations for approximation non-biased coefficients in the null models [3]. Then 1000 new samples generated for each “Blue Cap” in the market are ranked in decreasing order of the last closing price on 31.05.2018 to determine the 0.95 quantile of “B&H” strategy – this profit represents the market average return. After this step, profits of trading strategies are compared with “B&H” 0.95 quantile, and in case of exceeding 0.95 quantile by trading strategy profit, concludes that there is 95% probability of statistically significant profit of trading strategy with following asset in the Russian Equity market in the future.
The robustness check of Japanese Candlestick strategy considers the application of optimized trading systems to the crisis periods of 2008 and 2014 of Russian Market to show the effectiveness of Candlestick trading strategy during volatile time intervals [8]. The Monte-Carlo method and bootstrapping with RW and GARCH-M null models will be applied to generate random data samples with the 2008 and 2014 patterns to find 0.95 quantiles of “Buy and Hold” strategy profit.
Results
This section represents the returns of all the investigated Japanese Candlestick trading strategy modifications. Log returns represent the first differences between the stock price logarithms [11]. Total profits of trading systems are represented by weighted annual average returns.
Data
Daily open, close, maximum and minimum prices of 23 Russian “Blue Caps” stocks were downloaded from the finam[2] service. The same dividend adjusted prices were calculated using historical data of dividend payments from the Yahoo!Finance[3] source. Dividend adjusted time series of stock prices helps to avoid an artificial overstatement of trading strategies profitability for investor [2]. Optimized on training data trading systems are to be tested on both types of historical data: dividend adjusted prices and not.
Data samples includes the most liquid shares of Russian Stock Market, but due to the emergence of “new” stocks in this market, the number of Russian “Blue Caps” were brought up to 23 stocks. The choice of this types of stocks can be explained by the fact that technical analysis is most effective in actively traded financial instruments [12]. Thus, the data includes the Russian “Blue Caps” stock prices from 01.01.1999 to 31.05.2018, but the time intervals are unique for all the shares, and, therefore, the training and test samples of data were conducted independently for all assets. It means that trading strategies were optimized for each stock separately.
Japanese Candlestick trading strategy modifications
The graphic patterns following strategy
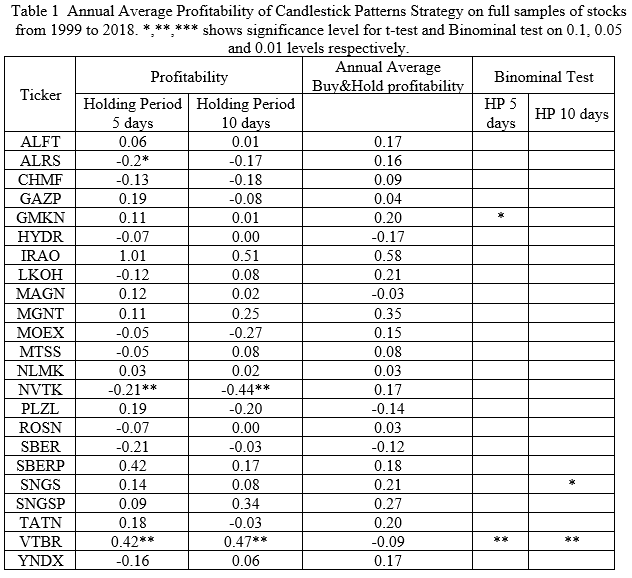
The results presented in this section show that Candlestick pattern following strategy returns are not statistically significant for 22 of 23 examined stocks (Table 1). However, following strategy brings statistically significant on 0.05 level (computed using t-test) annual average profit of 0.42 and 0.47 (5-day and 10-day holding period) for investor from 1999 to 2018. Thus, with 95% probability the basic Japanese Candlestick strategy applied to VTBR stocks will bring positive return in the future [12]. The average annual profit of the strategy for VTBR stocks is higher than that of the “Buy&Hold” strategy (-0.09). The binomial test results show that the 50% probability of correct trade prediction null hypothesis is rejected at 0.05 significance level. The descriptive statistics of most frequent Candlestick patterns from 1999 to 2018 can be seen in Table 2.
Japanese Candlestick trading strategy modified by stop-loss positions
Trading systems’ modifications and “effective” financial assets’ selection were conducted using training samples of each stock separately. Financial asset was called “effective” for further analysis if the return of trading strategy on training data met following conditions:

where r – trading strategy’s profit on training dataset for stock; I – specific stock name.

Where xi – optimized parameters for Candlestick trading system. After this step. the optimized trading strategy was to be tested on the test data for each asset that was “effective” on the training set.
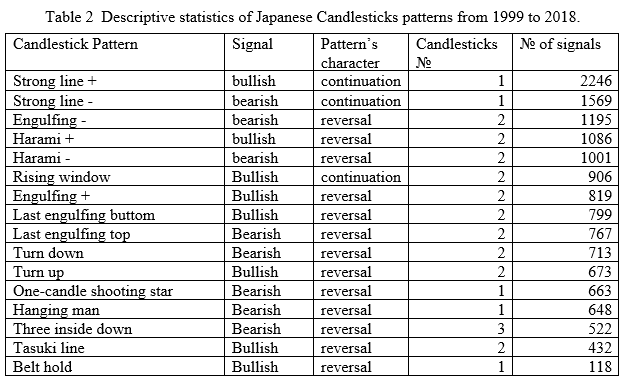
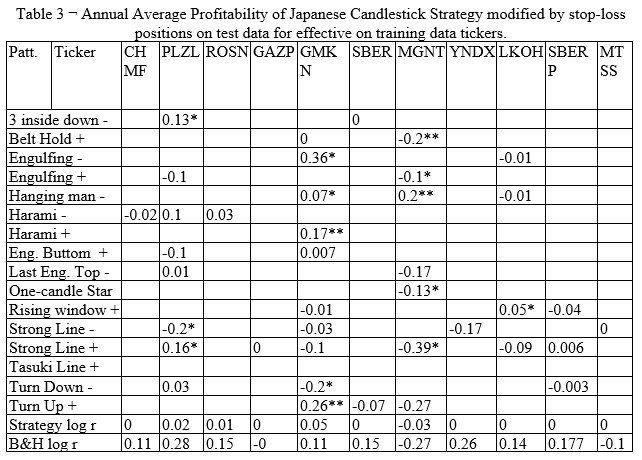
Table 3 shows the average annual profit of Candlestick trading strategy with stop-loss optimized parameters for each Candlestick pattern (1st column) and 11 stocks (the number of “effective” stocks were declined from 23 to 11 – 1st row) on test data. The returns of this modification did not exceed annual average returns by “B&H” strategy (last row of Table 3) during the same period. So. bootstrapping and Monte-Carlo methods with Random-Walk and GARCH-M null models are meaningless for further analysis. The annual returns following this trading strategy a likely to be statistically significant at 0.1 and 0.05 levels for GMKN and MGNT stock relating to other tickers (Table 3).
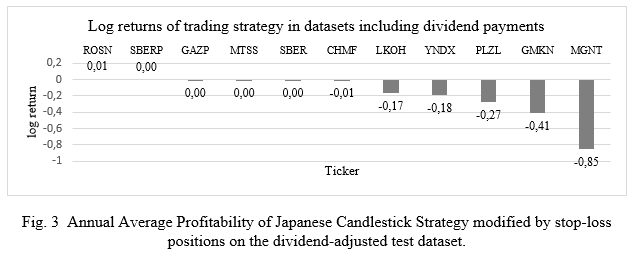
The effectiveness of following trading strategy was also tested on the dividend adjusted data. The results are worse than in previous step (Figure 3). The use of Monte-Carlo method and bootstrapping for identifying 0.95 “B&H” return quantiles took place only when profitability of trading strategy exceeds the “B&H” strategy on the same data for several stocks [11].
Japanese Candlestick trading strategy modified by stop-loss. trailing stop-loss and take-profit positions
The number of optimizing parameters in trading systems increased from 1 (stop-loss indicator) to 3 (Average True Range and Factor for trailing stop were added). Take-profit position equals 8% [12].
The returns of modified trading system on test datasets exceeds total returns of two previous Candlestick strategies (Table 4). Almost all patterns showed statistically significant at 0.05 level profits for 17 “effective” stocks in test dataset. both the annual average profitability of patterns and the total weighted sum increased.
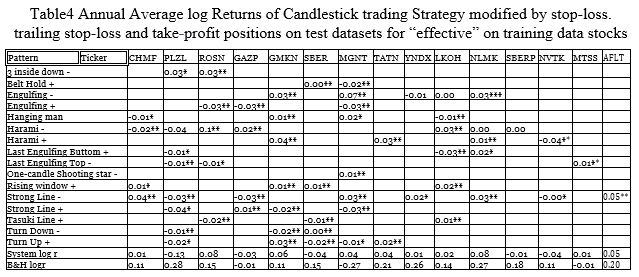
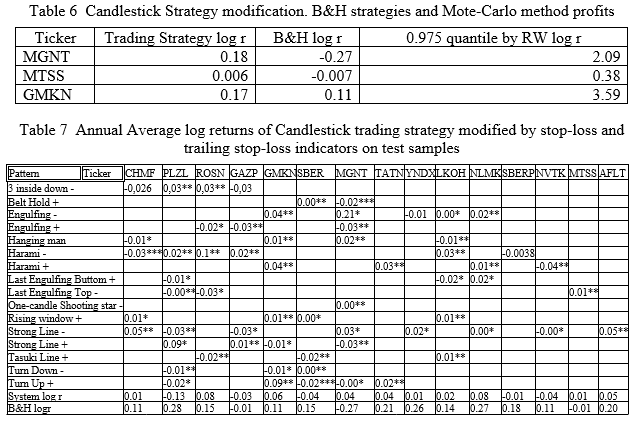
However. following profits are lower than those of “B&H” strategy at the same periods. except for the tickers of MGNT and MTSS – modified trading system of Japanese Candlestick gave profit that exceeds the “B&H” return. But Monte-Carlo methodology with RW null model shows that exceeding profits for these stocks at test datasets are not statistically significant (Table 5).

Japanese Candlestick trading strategy modified by stop-loss and trailing stop-loss positions
The main difference of the following trading strategy modification is absence of take-profit parameter which could reduce the profit of Japanese Candlestick patterns during sharp market changes [14]. The parameters optimized on training data are equal to those in the previous modifications.
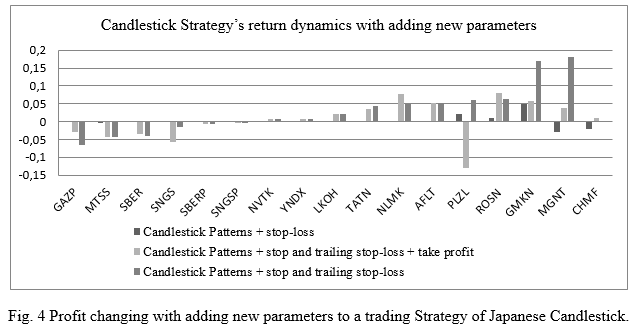
The positive trend of the annual average profits increasing of Japanese Candlestick pattern strategy occurs with the “complication” of trading system. Table 6 presents a comparison of the average annual log returns of the trading strategy. B&H strategy and 0.975 quantile of Monte-Carlo datasets with mean return and standard deviation from the historical data. Total annual profits by patterns and stocks are presented in Table 7.
Thus. the trading strategy of the Japanese Candlestick patterns and its 3 modifications are not able to bring a statistically significant profit for the investor in the Russian Equity Market for 22 of 23 stocks. One exception is the VTBR stock. the annual average logarithmic return of this stock by following candlestick patterns is 0.41 (50%) that is more than annual return of “B&H” strategy. The statistical significance at 0.05 level of this profit was proved by Student t-test.
With the complication of Japanese Candlestick patterns trading strategy by stop-loss. trailing stop-loss and take-profit indicators the profits are increasing (Figure 4). Hence. the search for the new indicators. mathematical oscillators of technical analysis. which would improve Japanese Candlestick trading strategy in the Russian Equity Market remains relevant.
Robustness check
In previous section it was proved that the Japanese Candlestick trading strategy and its 3 modifications are not profitable and do not exceed “B&H” strategy during the relatively steady economic situation in Russia. Sensitivity analysis of trading system in this article means to check the optimized modification of Japanese Candlestick strategy (stop-loss) during the world economic crisis time period (2008) and tough 2014 (due to international situation around Russia this year) [10].
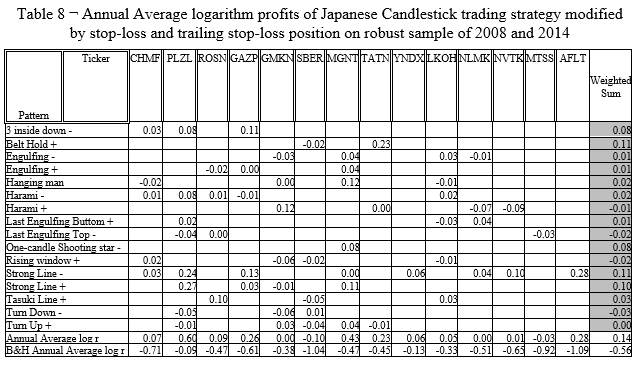
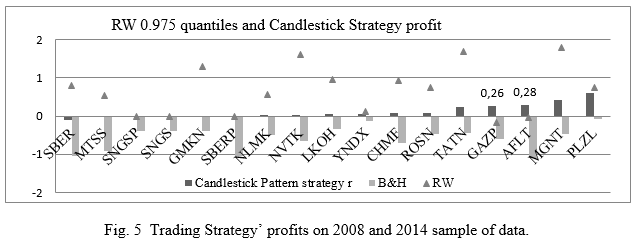
Table 8 presents the average annual logarithmic returns for all investigated stocks and Candlestick patterns on the sample of 2008 and 2014 and comparison of the weighted average annual profits of trading system and “B&H” strategy. Modification of Candlestick strategy is more profitable than “B&H” for all stocks during crisis periods. These results are very different with those from the test data for each “Blue Cap”. so Monte-Carlo check is needed. A Monte-Carlo iteration with RW null model shows that Candlestick trading strategy modified by stop-loss positions for GAZP and AFLT stocks with 95% probability would bring positive returns higher than average market (Figure 5). Optimized trading strategy’s annual average profits for GAZP and AFLT stocks are 0.26 and 0.28 respectively.
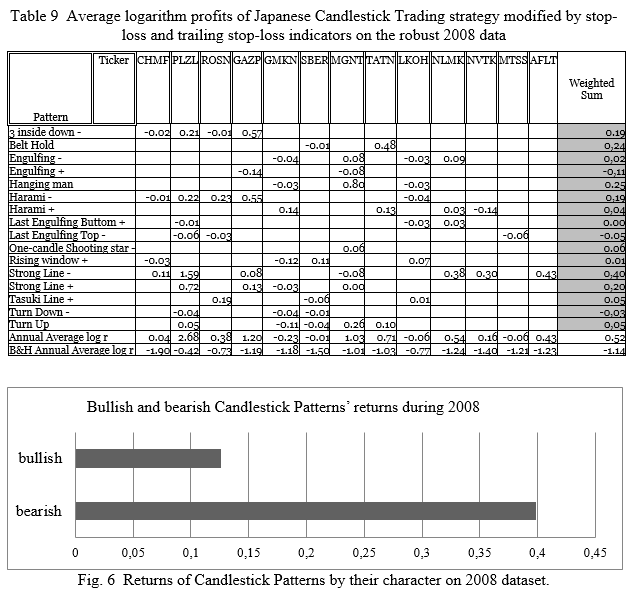
The robust sample was narrowed to 2008 data only to check the effectiveness of trading strategy in the “bearish” market with trend fluctuations. During 2008 all world market indexes. including the Moscow Stock Exchange (MICEX). had a downward trend. Table 9 represents annual weighted sum of log returns of Candlestick patterns which equals 0.52 (68%) during 2008 – that is much higher than the profit of -1.14 (-114%) of the passive “B&H” strategy during the same period. However. effective and profitable at downtrend 2008 period were both “bearish” and “bullish” patterns of Japanese Candlestick which can be explained by high predictive power of “bullish” patterns during short upper trend fluctuations of financial assets (Figure 6).
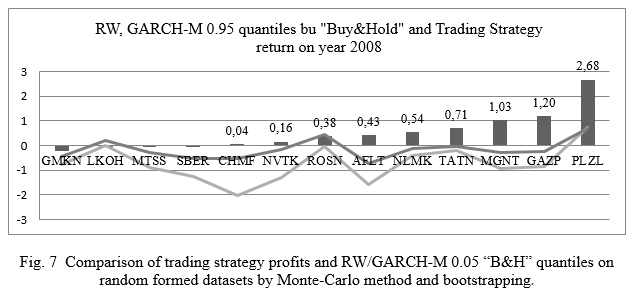
To verify the statistical significance of the results obtained in 2008 sample. the bootstrapping and Monte-Carlo methods with null RW and GARCH-M models respectively by using 2008 data patterns generated 1000 random one-year samples for each stock. Figure 7 shows 0.95 quantiles of “Buy&Hold” strategy returns of random datasets. which were formed using RW (orange line in the graph) and GARCH-M (grey line) null-models and comparison to Japanese Candlestick trading strategy profits. The statistical significance of trading system returns for 8 stocks at 0.05 level is proved by both RW and GARCH-M. It means 95% probability of higher average-market returns of Japanese Candlestick trading strategy modified by stop-loss and trailing stop-loss positions during the crisis periods of Russian Market for 8 Stocks.
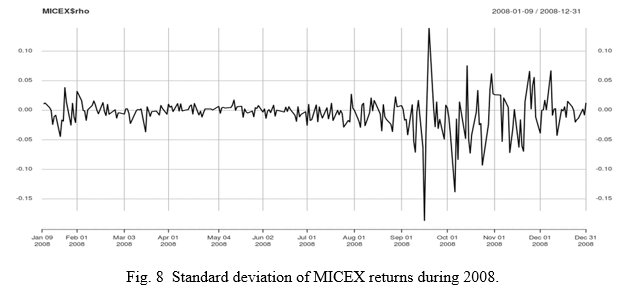
Thus. robustness check showed that Candlestick patterns are more effective during the downward market trend when the mean stock returns are negative and standard deviation is highly fluctuated like in the 2008 sample (Figure 8).
Conclusion
The results show that the application of Japanese candlestick patterns has no statistically significant profits for 22 out of 23 ‘Blue Caps’ of MICEX market index in Russia during 1999-2018 period (these shares were preselected as those with high potential for applying the trading strategy). Nevertheless. the robustness check of Japanese candlestick trading strategy modified by stop-loss positions showed the intriguing results on the 2008 and 2014 data. The profitability of all investigated stocks and candlestick patterns are much higher than the Buy&Hold strategy profit during the high fluctuated downward trend in the Russian market. It should be noted. that this phenomenon does not fit the definition of the Efficient Market [5].
On the one hand. the results can be interpreted as an evidence of inefficiency of relatively young Russian stock market because it was outplayed by the Japanese Candlestick strategy. On the other hand. it was outplayed only in the crisis periods. but in the rest. i.e. in normal time. application of the Japanese candlestick strategy showed absence of statistically significant profits for more than 95% of analyzed shares that leads to an outcome that the Russian stock market is efficient during normal time in terms of the efficient market hypothesis. Thus. from theoretical point of view. the results shed light on efficiency of the Russian stock market according to the efficient market hypothesis. From practical point of view. investors can apply the Japanese candlestick strategy as a safety ring. i.e. in normal time it does nothing. but during crisis periods it can save from high losses or even lead to gaining high profits. Moreover. analysts forecast that there will be a financial crisis in 2020. It means that Japanese candlestick trading strategy can be very useful in the near future.
References
- Dash R. & Dash P.K. A hybrid stock trading framework integrating technical analysis with machine learning techniques // The Journal of Finance and Data Science. 2016. Vol.2. No.1. Pp.42-57.
- Day T.E. & Wang P. Dividends. nonsynchronous prices. and the returns from trading the Dow Jones Industrial Average // Journal of Empirical Finance. 2002. Vol.9. No.4. Pp.431-454.
- Efron B. & Tibshirani R. Bootstrap methods for standard errors. confidence intervals. and other measures of statistical accuracy // Statistical Science. 1986. Pp.54-75.
- Engle R.F. & Granger C.W. Co-integration and error correction: representation. estimation. and testing // Econometrica: Journal of the Econometric Society. 1987. Pp.251-276.
- Fama E.F. & Blume M.E. Filter rules and stock-market trading // The Journal of Business. 1966. Vol.39. No.1. Pp.226-241.
- Gencay R. Linear. non-linear and essential foreign exchange rate prediction with simple technical trading rules // Journal of International Economics. 1999. Vol.47. No.1. Pp.91-107.
- Goo Y.. Chen D.. & Chang Y. The application of Japanese candlestick trading strategies in Taiwan // Investment Management and Financial Innovations. 2007. Vol.4. No.4. Pp. 49-79.
- Lu T.H.. & Chen J. Candlestick charting in European stock markets // JASSA. No.2. 2013.
- Lu T.H.. Chen. Y.C.. & Hsu. Y.C. Trend definition or holding strategy: What determines the profitability of candlestick charting? // Journal of Banking & Finance. 2015. Vol.61. Pp.172-183.
- Lu T.. Huang Y.. & Hsu C. Can price anomalies been obtained by using candlestick patterns. In Meeting of World Finance Conference. Venice. Italy. 2014.
- Marshall B.R.. Young M.R.. & Rose L.C. Candlestick technical trading strategies: Can they create value for investors? // Journal of Banking & Finance. 2006. Vol.30. No.8. Pp. 2303-2323.
- Morris G.L. Candlestick Charting Explained: Timeless Techniques for Trading Stocks and Futures: Timeless Techniques for Trading Stocks and Sutures. McGraw Hill Professional. 2006.
- Myr D. U.S. Patent No. 7.739.182. Washington. DC: U.S. Patent and Trademark Office. 2010.
- Nison S. Japanese candlestick charting techniques: a contemporary guide to the ancient investment techniques of the Far East. Penguin. 2001.
- Omrane W.B. & Van Oppens H. The performance analysis of chart patterns: Monte Carlo simulation and evidence from the euro/dollar foreign exchange market // Empirical Economics. 2006. Vol.30. No.4. Pp. 947-971.
- Peters Edgar E. Fractal Market Analysis: Applying Chaos Theory to Investment and Economics. New York: John Wiley and Sons. 1994.
- Schwager J.D. Technical analysis // John Wiley & Sons. 1996. Vol.43.
[1] Candle Scanner is a technical analysis software based on Japanese Candlestick patterns and other technical trading rules integration.
[2] Finam.ru is online service that provides historical data of financial instruments in Russian market
[3] Finance.yahoo.com is the website that provides historical market information all over the world